Rendering a reuseable D3 network / process flow diagram in Angular
Feb 8, 2021
Now that we have our SVG container from the last post, we are ready to draw the steps and links and routers of our data. I put some dummy data in the component.ts file for now, but eventually the component will have to get the data from an Angular service:
//network-graph.component.ts


import { Component, OnInit, ViewEncapsulation } from '@angular/core';
import * as d3 from 'd3';

import networkD3 from '../../../assets/networkD3/networkD3.js';

@Component({
  selector: 'app-network-graph',
  templateUrl: './network-graph.component.html',
  styleUrls: ['./network-graph.component.scss'],
  encapsulation: ViewEncapsulation.None,
})
export class NetworkGraphComponent implements OnInit {

  networkGraph = networkD3();

  dataset = {
    links: {
      "0": { source: "start", target: "7" },
      "1": { source: "7", target: "Router 1" },
      "2": { source: "7", target: "test" },
    },
    steps: {
      "start": { x: 50, y: 100 },
      "7": { x: 200, y: 100 },
      "test": { x: 350, y: 150 },
    },
    routers: {
      "Router 1": { x: 350, y: 50 },
      "Router 256": { x: 450, y: 250 },
    }
  };

  constructor() { }

  ngOnInit(): void {
    d3.select('.network-container').datum(this.dataset).call(this.networkGraph);
  }

}
Next we modify the networkD3.js module to draw the data. The steps and routers will be rounded rectangles and the links will be simple lines that connect them. To start, we add a new function called buildContainerGroups() and add groups for each type of element we are adding. The "g" tag in this code is standard SVG, it is an HTML "container used to group other elements" according to the Mozilla docs.
//networkD3.js

function buildContainerGroups() {
    let container = svg
        .append('g')
            .classed('container-group', true)
            .attr(
                'transform',
                `translate(${margin.left},${margin.top})`
            );

    container
        .append('g')
            .classed('link-group', true);

    container
        .append('g')
            .classed('step-group', true);

    container
        .append('g')
            .classed('router-group', true);

}
Since every visible element that will be rendered will be inside the container, we offset it from the parent <svg> by the margins we wish to set. Note that we are assigning a CSS class to each group - we will be able to style our elements by referencing each class later. Also note that order matters here. I am putting the links first because I want them rendered first - that way they will be behind the steps and routers. The links go from their Source center to Target center, so if they are above the steps and routers it will not look good.
Following the Pro D3.js book, I am calling the buildContainerGroups() function inside buildSVG():
//networkD3.js

function buildSVG(container) {
    if (!svg) {
        svg = d3.select(container)
            .append('svg')
                .classed('network-graph', true);
    }

    svg
        .attr('width', width)
        .attr('height', height)
    ;

    buildContainerGroups();
};
If you save the files and run Angular now, you should see the empty <g> container groups in the DOM if you look in the Developer tools, but of course you won't see anything visible on the page yet. Let's add the steps. No matter how many different shapes you have in your network diagram (you can use the same pattern for a process flow diagram or directed graph), just add a new function for each shape with a unique class name. Call each new function after buildSVG(this) in the exports function (the one that is being returned) - below I am calling drawSteps(). Here is the code for adding steps, but adding the routers is exactly the same with a different shape. Note that this is a simple implementation and doesn't do things like wrap the text labels yet. Right now I'm going for something that works and will make it pretty later.
//networkD3.js

function networkD3() {
    let data;
    let svg;
    let margin = {
        top: 20,
        right: 20,
        bottom: 30,
        left: 40
    };
    let width = 960;
    let height = 500;
    let chartWidth;
    let chartHeight;
    let stepWidth = 100;
    let stepHeight = 60;
    let stepCornerRadius = 10;
    let routerWidth = 100;
    let routerHeight = 80;
    let routerCornerRadius = 20;

    function exports(_selection) {
        _selection.each(function(_data) {
            data = _data;
            chartHeight = height - margin.top - margin.bottom;
            chartWidth = width - margin.left - margin.right;

            buildSVG(this);
            drawSteps();
        });
    };

    function drawSteps() {
        let steps = svg.select('.step-group').selectAll('.step').data(Object.entries(data.steps));
        let stepLabels = svg.select('.step-group').selectAll('.step-label').data(Object.entries(data.steps));

        steps.enter()
            .append('rect')
                .classed('step', true)
                .attr('width', stepWidth)
                .attr('height', stepHeight)
                .attr('x', (d) => d[1].x - stepWidth/2)
                .attr('y', (d) => d[1].y - stepHeight/2)
                .attr('rx', stepCornerRadius)
                .attr('ry', stepCornerRadius)
        ;

        steps.exit()
            .style('opacity', 0)
            .remove()
        ;

        stepLabels.enter()
            .append('text')
                .classed('step-label', true)
                .attr('x', (d) => d[1].x)
                .attr('y', (d) => d[1].y)
                .attr('text-anchor', 'middle')
                .attr('dominant-baseline', 'central')
                .text((d) => d[0])
        ;

        stepLabels.exit()
            .style('opacity', 0)
            .remove()
        ;

    }

//rest of function here...

}
What you are seeing will make sense if you have looked into D3. Attributes 'x', 'y', 'rx', and 'ry' are part of the SVG rectangle definition. Variables like stepWidth and stepCornerRadius I have declared and initialized at the very top of the module function, so later I can write closures that will let me get and set them when calling the module. Setting the x and y coordinates of each step involves accessing the data for that step (which is in the dataset in the component.ts file, above). See the tutorial on D3 data joins on d3indepth.com for details on the enter-exit pattern for each data point. The point index is accessed by the variable "i" and the data itself by "d". In the case above, d looks something like this for a given step: "start": { x: 50, y: 100 }. Using Object.entries converts this object to an array with d[0] = "start" and d[1] = { x: 50, y: 100 }. That is how we access the coordinates of each point from the data. In SVG notation, the 'x' and 'y' coordinates of the rectangle specify the rectangle's top left corner, so I have shifted the rectangle so that the coordinates in the data are in the center of the rectangle.
If we save and draw the chart as-is, we get 3 black rectangles that look like they could plausibly be in the right place given that the origin in SVG is at the top left corner. I've included the HTML so you can compare with our code:
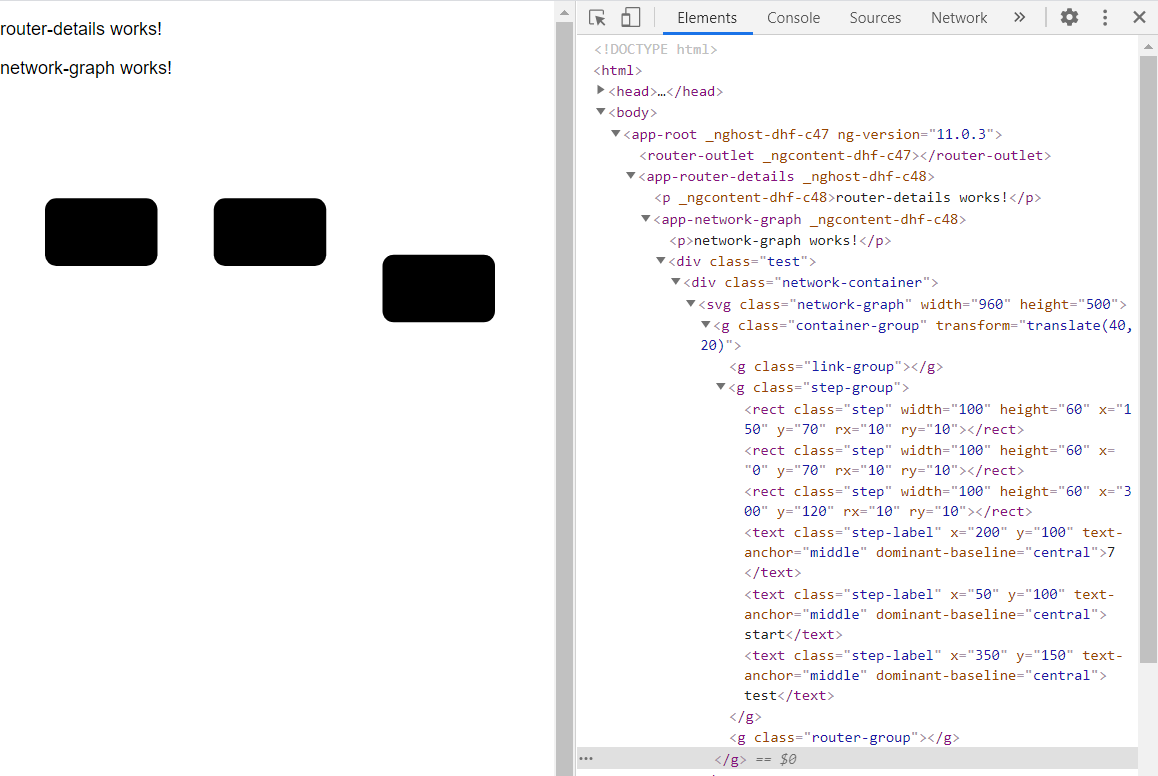
We can't see the labels because both the text and rectangle are default black. We can fix this with CSS, referencing the "step" class we gave each step. I will fix this soon, but want to draw the routers and links first so we can fix them all at the same time. The routers are done the same way as the steps were, but the links are a little different:
//networkD3.js

function drawLinks() {
 let links = svg.select('.link-group').selectAll('.link').data(Object.entries(data.links));
 let steps = data.steps;
 let routers = data.routers;

    links.enter()
        .append('line')
        .classed('link', true)
        .attr('x1', (d) => steps[d[1].source] ? steps[d[1].source].x
                            : routers[d[1].source] ? routers[d[1].source].x
                            : 0)
        .attr('y1', (d) => steps[d[1].source] ? steps[d[1].source].y
                            : routers[d[1].source] ? routers[d[1].source].y
       : 0)
        .attr('x2', (d) => steps[d[1].target] ? steps[d[1].target].x
                            : routers[d[1].target] ? routers[d[1].target].x
                            : 0)
        .attr('y2', (d) => steps[d[1].target] ? steps[d[1].target].y
                            : routers[d[1].target] ? routers[d[1].target].y
                            : 0)
    ;

    links.exit()
        .style('opacity', 0)
        .remove()
    ;


}
Each link is a simple line (two points: (x1, y1) and (x2, y2) as defined by SVG) and that connects two nodes for right now. The lines are drawn from the center of each node, as given by its x and y coordinates. What happened here is that a link can connect both steps and routers, so we have to check each type in the dataset to find the object key. I did this with nested conditional statements. Looking at the first link in the dataset "0": { source: "start", target: "7" }, d[1].source = "start". To find x1, we see if there exists a steps["start"]. If there does (if that statement is truthy), we use the value for x1 after the question mark, namely steps[d[1].source].x. If it does not we use the value that is after the colon which is itself another conditional expression checking in the routers array. If the key is not in either steps or routers, it assigns x1 to zero which makes the graph look funny. This is intentional because it will let us know that the data has somehow been corrupted.
If you save it at this point, you won't see any lines because they are by default white. However, you will be able to see the HTML for the lines in the developer tools. To style this diagram using the component css file we need to turn Angular's ViewEncapsulation off, which requires some considerations and should not be done lightly. That will be the topic of the next post.