Styling D3 charts in Angular
Feb 9, 2021
In the last post, we rendered a D3 network diagram using the reusable API pattern recommended in the book Pro D3.js by Marcos Iglesias. It still has a long way to go, but before we move on we need to style the chart so we can see it. Typically in Angular you can style a component with that component's specific CSS (or SCSS, or SASS, or...) file. But if you try that with Angular's default settings it won't work. The problem is that since D3 is drawing the chart, Angular doesn't know about the HTML elements in the chart at compile time, and so when they are drawn Angular considers them a child of your component and therefore outside the scope of the component style file (link goes to Angular documentation). Angular encapsulates the styles of each component so they don't affect other components in the app, which is normally a very good thing. In this case though, that View Encapsulation is what keeps the styles from applying to the chart. There are three solutions to this that I know about (if you know of something better please email me!):
- Apply the styles directly in the D3 javascript module, and provide closures for each so that they can be set each time the chart function is called from the component. This would add a lot of code to the module and the calling function.
- Use the deprecated :host ::ng-deep pseudo-classes to apply a style to the current component and all its children. Support is being removed from browsers so this really isn't a good long-term solution.
- Remove the View Encapsulation for the chart component only. This will make any style rules in the component style file global, applying to your entire app. Not ideal, but manageable if we are careful.
To remove View Encapsulation:
//network-graph.component.ts

import { Component, OnInit, ViewEncapsulation } from '@angular/core';
import * as d3 from 'd3';

import networkD3 from '../../../assets/networkD3/networkD3.js'; //our module

@Component({
  selector: 'app-network-graph',
  templateUrl: './network-graph.component.html',
  styleUrls: ['./network-graph.component.scss'],
  encapsulation: ViewEncapsulation.None, //this is the critical line
})
export class NetworkGraphComponent implements OnInit {

ngOnInit(): void {
    d3.select('.network-container').datum(this.dataset).call(this.networkGraph);
  }
//rest of component
To make sure that these styles are applied only to the chart in question, I will specify with class selectors to only style children of the parent <div> in the component.html file. For example, I currently have <div class="network-container"></div> as the only line in my component HTML file, and the D3 module selects that <div> when I call the function in ngOnInit(). In the CSS file, I can specify to only style elements that are children of the network-container class:
/* network-graph.component.scss */
.network-container {
background-color: lightgray;
cursor: default;
-webkit-user-select: none; /* The background should not be selectable */
-moz-user-select: none;
user-select: none;
}
.network-container .step {
stroke: black;
fill: white;
stroke-width: 1.5px;
cursor: pointer; /* A pointer cursor indicates interactivity */
}
.network-container .link {
stroke: #787878;
fill: none;
stroke-width: 5px;
cursor: pointer;
}
.network-container .router {
stroke: black;
fill: white;
stroke-width: 1.5px;
cursor: pointer;
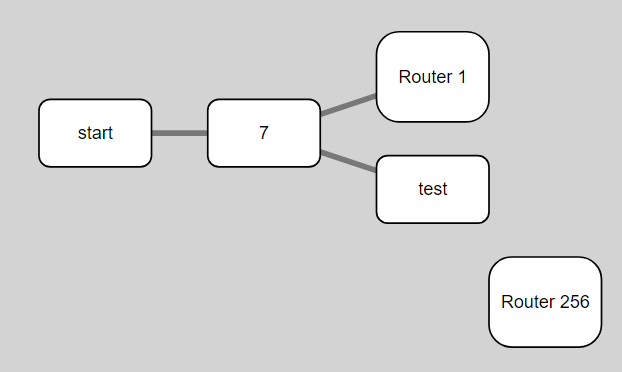
}If I have multiple charts in my app, I can use a different class name for the host div and get styling specific to that chart if I want it. Using the styles above, here is the chart:
There is more I want to do with the chart style but it will have to wait. Next I want to add tests for the rendering we have done and then add interactivity to the chart. In this case it will be the ability to add, delete, select, and move nodes and links. Onward!